Box Cox Transformation R
In statistical analysis, the Box-Cox transformation is a widely used technique for transforming non-normal data into approximately normal data. It is particularly useful when dealing with data that violates the assumptions of linear regression models. The Box-Cox transformation can be applied to various types of data, including time series data, and is available in the R programming language through the “car” package.
Why Use Box-Cox Transformation in R?
The Box-Cox transformation is mainly used to normalize skewed data and to meet the assumptions of statistical models. By transforming the data, it is possible to improve the accuracy and reliability of model results. Some of the key reasons for using Box-Cox transformation in R include:
1. Normality Assumption: Many statistical techniques assume that the data is normally distributed. The Box-Cox transformation helps to create approximately normally distributed data, thus meeting this assumption.
2. Linearity Assumption: Linear regression models assume a linear relationship between the independent variables and the dependent variable. By transforming the data, the Box-Cox transformation helps to meet this linearity assumption.
3. Homoscedasticity Assumption: The Box-Cox transformation can also address heteroscedasticity issues, where the variance of the errors is not constant across different levels of the predictors.
How to Install and Load the Box-Cox Transformation Package in R?
To perform Box-Cox transformation in R, you need to install and load the “car” package. Follow these steps to install and load the package:
1. Installation: Open R or RStudio and run the following command to install the “car” package:
“`r
install.packages(“car”)
“`
2. Loading: Once the package is installed, load it into your R environment using the following command:
“`r
library(car)
“`
Now you are ready to perform Box-Cox transformation in R.
What is Box-Cox Transformation?
The Box-Cox transformation is a power transformation that can be applied to the response variable (dependent variable) in a regression analysis. It aims to identify the optimal transformation parameter, lambda (λ), which will yield the best approximation to normality.
The Box-Cox transformation formula is as follows:
“`math
y(lambda) = (y^lambda -1)/lambda if lambda != 0
log(y) if lambda = 0
“`
Here, y is the original response variable, and lambda represents the transformation parameter. A range of lambda values are tried, and the optimal lambda is chosen based on the maximum log-likelihood approach, which maximizes the likelihood of obtaining the observed data.
How to Perform Box-Cox Transformation in R?
Performing the Box-Cox transformation in R involves the following steps:
1. Load the required libraries:
“`r
library(car)
“`
2. Specify the transformation using the “boxCox” function:
“`r
boxCox(y ~ x1 + x2, data = dataset)
“`
Replace “y” with the response variable and “x1” and “x2” with the predictor variables in your dataset.
3. Interpret the results:
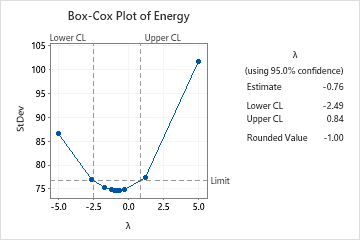
The “boxCox” function will return the optimal lambda value and a confidence interval. Positive lambda values indicate positive transformations, while negative lambda values suggest reciprocal transforms. A lambda of 0 represents a log transformation.
Interpreting the Results of Box-Cox Transformation in R
The results of the Box-Cox transformation in R provide important information for selecting the appropriate transformation. The output includes the values of lambda and a confidence interval. It is important to consider the following aspects when interpreting the results:
1. Lambda Value: The optimal lambda value suggests the power transformation that best approximates normality. A lambda of 1 implies no transformation, and a lambda of 0 suggests a log transformation.
2. Confidence Interval: The confidence interval provides a range of potential lambda values. It is helpful in determining the robustness and stability of the chosen transformation. A narrower interval indicates a more reliable estimate.
Advantages and Limitations of Using Box-Cox Transformation in R
Advantages:
1. Normalization: The Box-Cox transformation can convert skewed data into approximately normally distributed data, which is often a prerequisite for many statistical techniques.
2. Improved Model Performance: Applying the Box-Cox transformation can enhance the accuracy of statistical models by meeting the assumptions of normality, linearity, and homoscedasticity.
3. Flexibility: The Box-Cox transformation is flexible, accommodating a range of transformation options.
Limitations:
1. Sensitivity: The Box-Cox transformation is sensitive to extreme values and outliers. It may not be suitable for datasets with extreme observations.
2. Interpretability: After applying the transformation, the interpretation of the transformed variable becomes less intuitive. You may need to back-transform the results for a meaningful interpretation.
FAQs
Q: What is Box-Cox transformation and why is it used in R?
A: The Box-Cox transformation is a power transformation that converts non-normal data to approximate normality. It is used in R to meet the assumptions of statistical models, such as normality, linearity, and homoscedasticity.
Q: How do I install and load the Box-Cox transformation package in R?
A: To install the package, use the command install.packages(“car”). To load the package, use the command library(car).
Q: Can Box-Cox transformation be applied to time series data in R?
A: Yes, the Box-Cox transformation can be applied to time series data in R. By transforming the data, it can help address the non-normality and heteroscedasticity issues often present in time series analysis.
Q: Can Box-Cox transformation handle negative values in R?
A: The Box-Cox transformation assumes that the data has only positive values, as it involves taking the logarithms. If your data contains negative values, you may consider using alternative transformations, such as the Yeo-Johnson transformation, which handles negative values.
Q: What are some other data transformation techniques in R?
A: Apart from the Box-Cox transformation, R offers several other data transformation techniques, including the Yeo-Johnson transformation, log transformation, and various scaling methods like standardization and normalization.
Q: How can I perform a Box-Cox transformation for negative values in R?
A: As mentioned earlier, the Box-Cox transformation is not suitable for data with negative values. For such cases, you can consider using the Yeo-Johnson transformation, which is a modified version of the Box-Cox transformation that handles negative values.
Q: Is there a function in R for Box-Cox transformation?
A: Yes, R provides the “boxCox” function in the “car” package to perform the Box-Cox transformation. This function can calculate the optimal transformation parameter (lambda) and provide a confidence interval.
Box-Cox Transformation + R Demo
Keywords searched by users: box cox transformation r Box-Cox transformation là gì, Box Cox transformation in R time series, Box cox transformation excel, Yeo-Johnson transformation, Data transformation in R, Box cox transformation for negative values, Stats boxcox, Log transformation in R
Categories: Top 66 Box Cox Transformation R
See more here: nhanvietluanvan.com
Box-Cox Transformation Là Gì
Box-Cox transformation is a statistical technique that is used to transform non-normal data into a normal distribution. The technique was proposed by statisticians George Box and David Cox in 1964 and has since become a common tool in the field of statistics.
The purpose of the Box-Cox transformation is to stabilize the variance of data and to make it adhere to the assumptions of many statistical models, which assume normality and homoscedasticity (equal variance). By transforming the data, we can improve the accuracy and efficiency of statistical tests and models that are based on these assumptions.
The Box-Cox transformation is defined by the following equation:
y(lambda) = (y**lambda – 1) / lambda
where y is the original dataset, lambda is a parameter that determines the type of transformation to be applied, and y(lambda) is the transformed dataset.
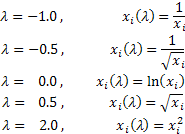
The parameter lambda can take any real number, including zero. The choice of lambda determines the type of Box-Cox transformation applied. For example, when lambda = 0, the transformation is equivalent to taking the logarithm of the data.
The optimal value of lambda can be determined using statistical methods such as maximum likelihood estimation. However, in practice, different lambda values are often tried and the one that results in the best transformation is chosen.
While the Box-Cox transformation is primarily used for normality, it can also be applied to skewed data to reduce skewness and achieve a closer approximation to normality. This makes it a versatile tool that can be applied to various types of non-normal data.
The application of the Box-Cox transformation can be seen in various areas of statistics and data analysis. It is commonly used in regression analysis, where it improves the quality of the model by transforming the response variable. It is also employed in time series analysis, where it helps to stabilize the variance and improve forecasting accuracy.
Additionally, the Box-Cox transformation finds its utility in quality control, experimental design, and other fields that rely on statistical analysis. By transforming data, it allows for a more accurate assessment of relationships, comparisons, and predictions in the presence of non-normality.
FAQs about Box-Cox transformation:
1. Q: What is the main benefit of using Box-Cox transformation?
A: The main benefit is the ability to transform non-normal data into a normal distribution, which allows for the application of statistical tests and models that assume normality. This improves the accuracy and efficiency of the analysis.
2. Q: How does one determine the optimal value of lambda?
A: The optimal value of lambda can be determined using statistical methods such as maximum likelihood estimation. However, it is often determined empirically by trying different lambda values and selecting the one that results in the best transformation.
3. Q: Can the Box-Cox transformation be applied to all types of non-normal data?
A: Yes, the Box-Cox transformation can be applied to various types of non-normal data, including skewed data. It helps to reduce skewness and achieve a closer approximation to normality, making it a versatile tool.
4. Q: Are there any limitations of using the Box-Cox transformation?
A: One limitation is that it assumes a monotonically increasing relationship between the original data and lambda. If this assumption is violated, an alternative transformation method may be more appropriate. Additionally, extreme outliers in the data can affect the transformation’s effectiveness.
5. Q: Can the Box-Cox transformation completely eliminate non-normality?
A: The Box-Cox transformation can significantly reduce non-normality, but it may not always completely eliminate it. The effectiveness of the transformation depends on the characteristics of the data and the chosen lambda value.
In conclusion, the Box-Cox transformation is a valuable statistical technique that allows for the transformation of non-normal data into a normal distribution. Its broad applications in various fields make it a useful tool for improving the accuracy and efficiency of statistical analysis. By understanding and utilizing the Box-Cox transformation, researchers and analysts can overcome the challenges posed by non-normality and gain meaningful insights from their data.
Box Cox Transformation In R Time Series
Introduction
Time series analysis is a widely used technique in various domains, ranging from finance and economics to weather forecasting and epidemiology. One crucial step in analyzing time series data is ensuring that the data meets the assumptions of the chosen statistical model. There are times when the data violates these assumptions, resulting in inaccuracies and inefficiencies in the analysis. To overcome this challenge, the Box Cox transformation can be applied to the data. In this article, we will explore the Box Cox transformation in the context of time series analysis using R, a popular programming language for statistical computing.
What is the Box Cox Transformation?
The Box Cox transformation is a data transformation technique that aims to stabilize the variance of a time series. It was introduced by statisticians George Box and David Cox in their influential 1964 paper. The transformation involves applying a mathematical function to the data, which optimizes the transformation parameter λ. This parameter controls the extent of the transformation and can take any real value, allowing for a wide range of transformations.
Applying the Box Cox transformation can address common issues in time series analysis, such as heteroscedasticity (unequal variances) and non-normality. These issues often arise due to the nature of the data, and correcting them is crucial for accurate modeling and forecasting.
Using the Box Cox Transformation in R
R provides several functions to implement the Box Cox transformation. One commonly used function is the `boxcox()` function from the `MASS` package. This function calculates the optimal λ value for the transformation based on maximum likelihood estimation, and it also provides confidence intervals for λ.
To illustrate the usage of the Box Cox transformation in R, let’s consider an example with a time series dataset `ts_data`. We can apply the transformation using the following code:
“`r
library(MASS)
transformed_data <- boxcox(ts_data)
lambda <- transformed_data$x[which.max(transformed_data$y)]
```
In the code snippet, we load the `MASS` package and apply the `boxcox()` function to the `ts_data`, storing the result in `transformed_data`. We then identify the λ value that maximizes the likelihood by using `which.max(transformed_data$y)` and assign it to the variable `lambda`.
Benefits of the Box Cox Transformation
1. Variance Stabilization: By transforming the time series data, the Box Cox transformation helps stabilize the variance, making statistical modeling and forecasting more reliable. This is particularly useful when dealing with data that exhibits heteroscedasticity, where the variance changes over time.
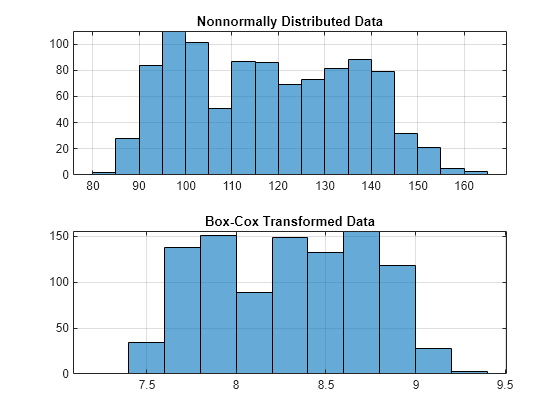
2. Enhancing Normality: The Box Cox transformation can also improve the normality of skewed data distributions. Transforming the data can help the model assumptions of normality hold, leading to more accurate parameter estimation and reliable inference.
3. Flexibility: The Box Cox transformation allows for a wide range of transformations, as the parameter λ can take any real value. This flexibility accommodates non-linear relationships in the data, enabling better fitting of statistical models.
4. Confidence Intervals for λ: The Box Cox transformation function in R also provides confidence intervals for the λ parameter. These intervals offer insights into the uncertainty associated with the optimal transformation and assist in selecting the appropriate transformation.
FAQs about Box Cox Transformation in R Time Series
Q1: Why is it important to stabilize the variance of time series data?
A1: Stabilizing the variance is crucial because many time series models assume homoscedasticity (equal variance) to provide accurate estimates. Failing to stabilize the variance can lead to biased and inefficient parameter estimates, affecting the reliability of model results.
Q2: Can the Box Cox transformation handle negative values?
A2: The Box Cox transformation cannot handle negative values by default. However, a common workaround is to shift the data by a constant so that all values are positive before applying the transformation. After the transformation, the constant can be subtracted to bring the data back to its original scale.
Q3: How can I interpret the value of λ?
A3: The value of λ provides insights into the type and extent of the transformation applied. If λ is close to 0, it implies a logarithmic transformation. λ = 1 represents the identity transformation (no transformation), while positive or negative values denote power transformations. Generally, larger absolute values of λ indicate stronger transformations.
Q4: Are there alternative transformation methods to Box Cox?
A4: Yes, there are alternative transformation methods, such as the log transformation, square root transformation, and Johnson transformation. Each method has its own assumptions and characteristics, so it's important to assess which transformation works best for a particular dataset and analysis objective.
Conclusion
The Box Cox transformation is a valuable tool in time series analysis for stabilizing variance and enhancing normality. By addressing common issues like heteroscedasticity and non-normality, the Box Cox transformation enables accurate modeling and reliable forecasting. R provides convenient functions, such as `boxcox()` from the `MASS` package, to easily implement the transformation and estimate the optimal λ parameter. By leveraging the power of the Box Cox transformation in R, analysts and researchers can ensure their time series data meets the assumptions of their statistical models, leading to more robust and accurate results.
Images related to the topic box cox transformation r

Found 29 images related to box cox transformation r theme







Article link: box cox transformation r.
Learn more about the topic box cox transformation r.
- Box Cox transformation in R | R-bloggers
- How to Perform a Box-Cox Transformation in R (With Examples)
- Box-Cox transformation in R [boxcox function from … – R Coder
- 6.11 Box-Cox Transformations | Stat 242 Notes: Spring 2022
- What is box cox transformation in R? – ProjectPro
- boxcox function – RDocumentation
- Box-cox transformation
See more: https://nhanvietluanvan.com/luat-hoc/