Matplotlib Save Figure As Svg
Matplotlib is a powerful and widely used plotting library in Python. It allows users to create a variety of visualizations, ranging from simple line plots to complex 3D scatter plots. One important aspect of data visualization is the ability to save the figures in different formats for various purposes, such as printing, web publishing, or further editing.
In this article, we will focus on saving figures as Scalable Vector Graphics (SVG) in Matplotlib. SVG is a vector-based image format that offers several advantages over other formats like JPEG or PNG. We will discuss the benefits of using SVG, the steps to save figures as SVG in Matplotlib, ways to customize SVG files, tips and best practices, and conclude with a summary of the key points.
Advantages of Saving Figures as SVG in Matplotlib:
SVG is a popular choice for saving figures because of its scalability. Unlike raster formats like JPEG or PNG, which consist of a fixed number of pixels, SVG is based on mathematical equations that describe the shapes and lines making up the image. This means that SVG files can be scaled up or down without any loss of quality or resolution. Whether you need a small thumbnail or a high-resolution printout, the image will retain its sharpness and clarity.
Another advantage of SVG is its interactivity. SVG files can contain interactive elements like hyperlinks, tooltips, or animations. This makes them ideal for use on the web or in interactive presentations, where users can click or hover over elements to reveal additional information or perform actions. Saving figures as SVG allows for easy customization and adding interactivity using external tools or libraries.
Furthermore, SVG files are easy to edit and modify. Since they are based on mathematical descriptions, the shapes and lines can be easily manipulated using vector graphics software. This makes it straightforward to change colors, adjust sizes, or add annotations to the saved figures. Unlike raster formats, where editing can lead to pixelation and loss of quality, SVG files maintain their smooth lines and shapes even after modifications.
How to Save Figures as SVG in Matplotlib:
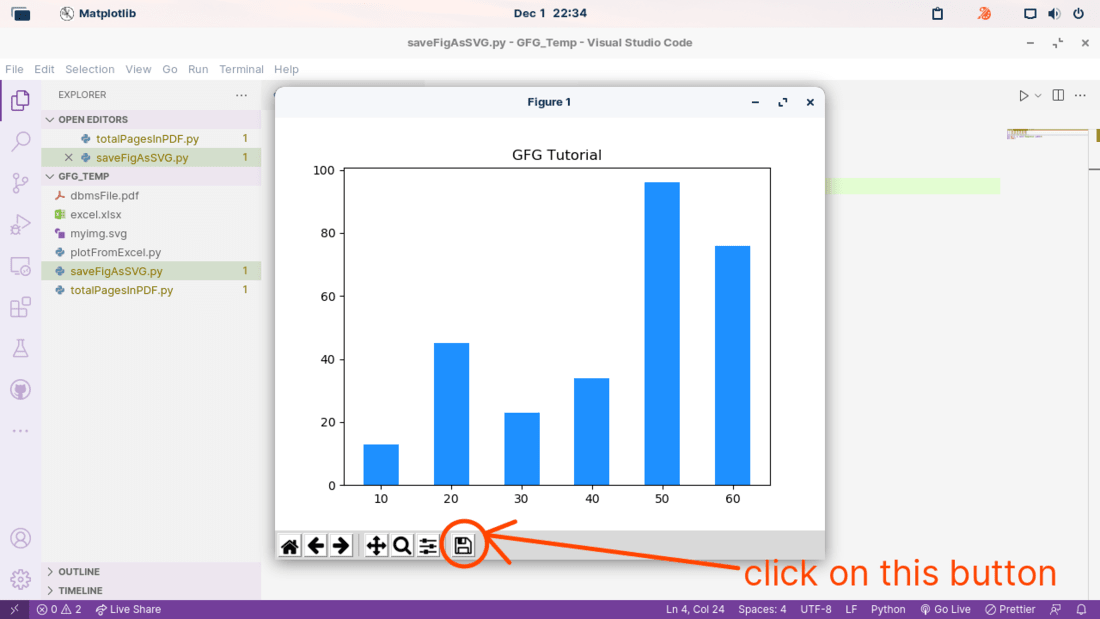
Saving figures as SVG in Matplotlib is a straightforward process. The library provides a function called `savefig()`, which allows us to specify the output format, file path, and other options. To save a figure as an SVG file, follow these steps:
Step 1: Import the necessary libraries and modules:
“`python
import matplotlib.pyplot as plt
“`
Step 2: Create a figure and plot the desired data:
“`python
fig, ax = plt.subplots()
ax.plot(x, y)
“`
Step 3: Save the figure as an SVG file:
“`python
plt.savefig(‘path/to/save/file.svg’, format=’svg’)
“`
In the above code snippet, replace `’path/to/save/file.svg’` with the desired location and filename for your SVG file. The `format=’svg’` parameter ensures that the figure is saved in the SVG format.
Customizing SVG Files in Matplotlib:
Matplotlib provides various options to customize the appearance and layout of SVG figures. These options can be used to add titles, labels, legends, annotations, and many other visual elements to enhance the readability and aesthetics of the figure. Here are a few examples:
1. Adding a title:
“`python
ax.set_title(‘Title’)
“`
2. Setting axis labels:
“`python
ax.set_xlabel(‘X label’)
ax.set_ylabel(‘Y label’)
“`
3. Adding a legend:
“`python
ax.legend()
“`
4. Adding text annotations:
“`python
ax.text(x, y, ‘Annotation’)
“`
5. Changing the color palette:
“`python
ax.plot(x, y, color=’red’)
“`
These are just a few examples of the many customization options available in Matplotlib. Experiment and explore the documentation to discover more ways to customize your SVG figures to suit your specific needs.
Tips and Best Practices for Saving Figures as SVG:
Here are some tips and best practices to consider when saving figures as SVG in Matplotlib:
1. Choose an appropriate resolution: Decide on the desired output resolution based on the intended use of the figure. Higher resolutions will result in larger file sizes.
2. Use transparent backgrounds: If you want to place the figure on a different background or overlay it on another image, save it with a transparent background.
3. Optimize file size: SVG files can become large, especially when they contain complex shapes or elaborate annotations. Optimize the file size by simplifying paths, removing unnecessary elements, or compressing the file.
4. Ensure compatibility: Test your saved SVG files on different platforms and software to ensure compatibility. Some software may render SVG files differently or have limited support for certain SVG features.
5. Consider using Seaborn: Seaborn is a popular data visualization library built on top of Matplotlib. It offers predefined themes, styles, and color palettes that can enhance the appearance of your figures. Saving Seaborn figures as SVG provides the same benefits as saving regular Matplotlib figures.
Conclusion:
In conclusion, saving figures as SVG in Matplotlib offers several advantages over raster formats. SVG files are scalable, interactive, and easily editable, making them suitable for a wide range of applications. By following the steps outlined in this article, you can save your Matplotlib figures as SVG and take advantage of the many customization options available. Remember to consider best practices, such as optimizing file size and ensuring compatibility, to get the most out of your saved SVG figures. So go ahead and start using SVG as your preferred format for saving Matplotlib figures, and unlock the potential for versatile, high-quality visualizations.
How To Save A Figure / Chart / Plot In Jupyter Notebook | Python Matplotlib Tutorial For Savefig()
Can Matplotlib Save As Svg?
Matplotlib is a popular data visualization library in Python that provides a wide range of functions to create high-quality plots, charts, and figures. But what if you need to save your plots in a scalable vector graphics (SVG) format? Can Matplotlib save as SVG? In short, yes, Matplotlib has the capability to save figures as SVG files, offering several advantages for users. In this article, we will delve into the details of saving Matplotlib figures as SVG and explore some commonly asked questions.
Why Save Figures as SVG?
SVG is a widely supported vector graphics format that is particularly useful when you need to display your plots on different devices with varying resolutions. Unlike raster image formats like JPG or PNG, SVG files are not pixel-based but rather consist of mathematical descriptions of the objects they depict. As a result, SVG images can be scaled to any size without losing quality. This scalability ensures that your plots will look sharp and clear on any device, from low-resolution screens to high-definition monitors.
Moreover, SVG files are lightweight and can be easily edited using various software tools, including vector graphics editors like Adobe Illustrator or open-source alternatives like Inkscape. This flexibility allows you to fine-tune the appearance of your plots or add additional elements to further enhance their visual appeal.
Saving Matplotlib Figures as SVG
Matplotlib provides a straightforward way to save figures as SVG files. The `savefig()` function is the key component to accomplish this task. To save a figure as an SVG file, you can pass the file name with the `.svg` extension to the `savefig()` function.
“`python
import matplotlib.pyplot as plt
plt.plot([1, 2, 3, 4], [1, 4, 9, 16])
plt.savefig(“figure.svg”)
“`
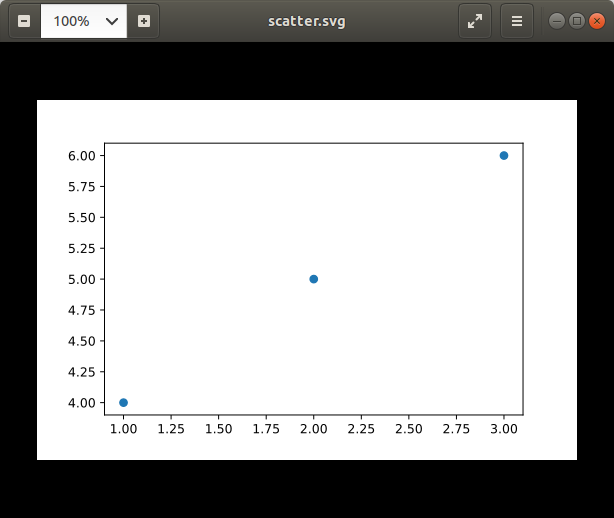
In this example, the `plot()` function is used to create a simple line plot, and then `savefig()` is called with the file name “figure.svg”. This will save the figure as an SVG file in the current working directory.
It is worth mentioning that Matplotlib provides numerous parameters to customize the appearance of the saved SVG file. For example, you can specify the dimensions, adjust the DPI (dots per inch), set the background color, and control the quality of the exported image. These parameters allow you to fine-tune the output to meet your specific requirements.
Commonly Asked Questions
Q: Can I save multiple plots in a single SVG file using Matplotlib?
A: Yes, Matplotlib allows you to save multiple plots in a single SVG file. To achieve this, you can create a figure with multiple subplots and then save the entire figure using the `savefig()` function.
Q: How can I change the size of the SVG file?
A: Matplotlib provides you with the flexibility to specify the dimensions of the SVG file. You can use the `figsize` parameter in the `savefig()` function to adjust the width and height of the output file.
Q: Can I change the resolution of the saved SVG file?
A: Yes, the DPI (dots per inch) parameter in the `savefig()` function allows you to adjust the resolution of the saved SVG file. Higher DPI values result in higher image quality, while lower values reduce the file size.
Q: Are there any drawbacks to using SVG files?
A: While SVG files offer numerous advantages, they may not be suitable for all scenarios. Since SVG files store mathematical descriptions of the objects, complex plots with a large number of data points can result in larger file sizes. Additionally, some image editing tools may not fully support all SVG features, potentially limiting your ability to edit or enhance the plots.
Q: Can I include text in my SVG plots?
A: Absolutely! Matplotlib allows you to add various text elements to your plots, such as titles, labels, annotations, and legends. These text elements are included in the SVG file and can be edited or modified using compatible software tools.
Conclusion
In conclusion, Matplotlib provides a straightforward way to save figures as SVG files. SVG format offers numerous advantages, including scalability, device independence, and flexibility for editing. By utilizing the `savefig()` function, you can easily export your Matplotlib plots in SVG format, ensuring high-quality visuals for various purposes. Remember to experiment with the customization options available to further optimize the output according to your needs.
How To Create Svg From Image In Python?
Scalable Vector Graphics (SVG) is a popular XML-based vector image format that has gained widespread usage in various fields, such as web development, graphic design, and data visualization. Python, being a flexible and powerful programming language, provides several libraries that enable the conversion of raster images into SVG. In this article, we will explore different approaches to create SVG from an image using Python and discuss some frequently asked questions related to this topic.
Table of Contents:
1. Introduction to SVG
2. Using the svglib Library
3. Utilizing the CairoSVG Library
4. Understanding the svgwrite Library
5. Frequently Asked Questions (FAQs)
a. Can we convert any type of image to SVG?
b. Is SVG resolution independent?
c. Are there any limitations when converting an image to SVG?
d. What are the advantages of using SVG over raster images?
e. Are there any performance considerations when working with SVG?
1. Introduction to SVG:
Before diving into the ways to create SVG from an image in Python, let’s briefly understand what SVG is. SVG is a W3C-recommended XML-based vector image format that supports interactivity and animation. Unlike raster images (e.g., JPEG or PNG), SVG images define objects using mathematical descriptions rather than a fixed number of pixels. This feature allows SVG images to scale without losing quality, making them ideal for responsive design and high-resolution displays.
2. Using the svglib Library:
The svglib library in Python provides functionalities to convert raster images into SVG. It supports a wide range of input image formats, including BMP, GIF, JPEG, PNG, and TIFF. By utilizing svglib, we can read an input image and generate SVG output using the following steps:
1. Install the svglib library using pip: `pip install svglib`.
2. Import the required modules: `from svglib.svglib import svg2rlg`.
3. Load the input image: `drawing = svg2rlg(‘input_image.png’)`.
4. Save the image as SVG: `drawing.writeSVG(‘output_image.svg’)`.
3. Utilizing the CairoSVG Library:
CairoSVG is another powerful library that enables the conversion of raster images to SVG in Python. Apart from converting images, it also supports a plethora of features related to SVG manipulation, such as scaling, cropping, rotating, and applying filters. The steps to convert an image to SVG using CairoSVG are as follows:
1. Install the CairoSVG library using pip: `pip install CairoSVG`.
2. Import the required modules: `import cairosvg`.
3. Convert the image to SVG: `cairosvg.svg2svg(url=’input_image.png’, write_to=’output_image.svg’)`.
4. Understanding the svgwrite Library:
The svgwrite library provides a high-level Python interface to generate SVG files from scratch or modify existing SVGs. While it primarily focuses on creating SVG content, it can also be used to convert raster images to SVG. Here’s a brief overview of the steps involved:
1. Install the svgwrite library using pip: `pip install svgwrite`.
2. Import the required modules: `import svgwrite`.
3. Create a new SVG object: `dwg = svgwrite.Drawing(‘output_image.svg’, profile=’tiny’)`.
4. Load the input image: `image = dwg.image(‘input_image.png’)`.
5. Add the image to the SVG: `dwg.add(image)`.
5. Frequently Asked Questions (FAQs):
a. Can we convert any type of image to SVG?
While the discussed libraries support numerous common image formats, not all images can be accurately converted to SVG. The image intricacy, quality, and complexity may impact the conversion process. Simple images with clear lines and shapes tend to convert better than complex images with intricate textures and gradients.
b. Is SVG resolution independent?
Yes, SVG is resolution independent as it defines graphics using scalable vector paths. It allows the image to be scaled up or down without compromising its quality or sharpness, making it suitable for various display sizes and resolutions.
c. Are there any limitations when converting an image to SVG?
Converting raster images to SVG has its limitations. While basic shapes and lines are accurately converted, complex textures and gradients may lose some details. Additionally, transparent background areas in the original image might not be faithfully retained in the SVG output.
d. What are the advantages of using SVG over raster images?
SVG offers several advantages over raster images. It enables infinite scalability without loss of quality, resulting in sharp and crisp visuals at any size. Moreover, SVG files are typically smaller in size compared to raster image equivalents, reducing network transfer and load times.
e. Are there any performance considerations when working with SVG?
Rendering complex SVG files can be computationally expensive compared to rendering raster images. If working with a large number of SVG files or rendering complex animations, it is recommended to optimize the SVG files, simplify paths, and leverage capabilities like SVG caching and lazy loading to enhance performance.
In conclusion, Python provides various libraries, such as svglib, CairoSVG, and svgwrite, that enable the conversion of raster images to SVG. These libraries offer different approaches with varying features and capabilities, allowing developers to choose the one that best suits their requirements. By leveraging the power of Python and SVG, developers can enhance their data visualization, web design, and graphics projects, producing resolution-independent images that scale seamlessly across different devices and resolutions.
Keywords searched by users: matplotlib save figure as svg Matplotlib cannot save figure, save plot as svg r, Matplotlib to SVG, Save plot as vector graphic python, Plt savefig figure size, Plt savefig does not save full image, Seaborn save figure, Savefig matplotlib
Categories: Top 49 Matplotlib Save Figure As Svg
See more here: nhanvietluanvan.com
Matplotlib Cannot Save Figure
Matplotlib is a widely used Python library that provides a comprehensive toolkit for creating static, animated, and interactive visualizations. It offers a high-level interface for generating plots, charts, and other 2D graphics, allowing users to create professional-quality figures with ease. However, one common issue that many users face is the inability to save the figures they have created. In this article, we will delve into the reasons why Matplotlib cannot save a figure and provide some troubleshooting tips and workarounds to resolve this problem.
Why Can’t Matplotlib Save Figures?
There are several possible reasons why Matplotlib may fail to save a figure, and understanding these can help in troubleshooting the issue effectively. Some common causes include:
1. Incorrect File Path: If the file path provided for saving the figure is incorrect or inaccessible, Matplotlib may not be able to save the figure. Double-checking the path and ensuring that the user has appropriate write permissions is crucial.
2. File Formatting: Matplotlib supports a wide range of file formats for saving figures, including PNG, JPG, PDF, and SVG, among others. However, using an unsupported or incorrectly specified file format can prevent saving. It is essential to verify that the chosen format is compatible with Matplotlib.
3. Backend Configuration: Matplotlib utilizes different backends to display and save figures. Each backend has its own requirements and dependencies. In some cases, the default backend configuration may be incompatible with the desired file format, leading to an inability to save figures.
4. Software Dependencies: Matplotlib also relies on various external software dependencies to save figures in specific formats. For instance, saving figures in PDF format requires a working installation of LaTeX. If the necessary dependencies are missing, saving the figure may fail.
Troubleshooting Tips and Workarounds
When facing difficulties saving figures in Matplotlib, consider the following tips and workarounds to overcome the problem:
1. Double-check File Path: Ensure that the file path specified for saving the figure is correct, exists, and has the necessary write permissions. Using an absolute file path is generally more reliable, as it avoids any ambiguity in locating the file.
2. Verify File Format: Confirm that the chosen file format is supported by Matplotlib. Refer to the official Matplotlib documentation to find a comprehensive list of supported file formats. Additionally, double-check that the file extension matches the actual format being saved.
3. Change Backend Configuration: Matplotlib allows users to switch between different backends, each with its own strengths and limitations. Try changing the backend configuration to one that is compatible with both your desired file format and your system’s capabilities.
“`
import matplotlib
matplotlib.use(‘Agg’) # Use the ‘Agg’ backend for saving figures.
import matplotlib.pyplot as plt
“`
Here, the ‘Agg’ backend is a non-interactive one that is specifically designed for saving figures to files.
4. Install Required Software Dependencies: If you are attempting to save figures in formats such as PDF, EPS, or SVG, make sure that the necessary external software dependencies are installed on your system. For example, for PDF output, ensure that a functional LaTeX installation is present.
Matplotlib Save Figure FAQs
Q1. Can I save a Matplotlib figure directly from Jupyter Notebook?
Yes, you can save a Matplotlib figure directly from a Jupyter Notebook. Use the `savefig()` function with the desired file path and file format to save the figure to your preferred location.
Q2. Why am I getting a ‘TypeError: cannot pickle’ error when trying to save a figure?
This error commonly occurs when attempting to save a figure containing objects that cannot be pickled, such as functions or instances of classes defined in some local scope. Make sure that only picklable objects are present in the figure before saving. If necessary, refactor the code to avoid pickling issues.
Q3. How can I save a Matplotlib figure with a high resolution for print or publication?
To save a high-resolution figure, you can increase the `dpi` (dots per inch) value of the saved figure using the `dpi` parameter of the `savefig()` function. For example:
“`
plt.savefig(‘figure.png’, dpi=300)
“`
Here, a dpi value of 300 ensures a higher resolution output suitable for printing or publication.
In conclusion, Matplotlib’s inability to save figures can be frustrating, but by understanding the potential causes and following these troubleshooting tips and workarounds, users can resolve the issue and save their figures successfully. Remember to double-check file paths, verify file formats, modify backend configurations if needed, and ensure that all necessary software dependencies are installed. Matplotlib’s flexibility and rich functionality make it a reliable choice for data visualization, and with the right approach, users can overcome any hurdles that come their way.
Save Plot As Svg R
Introduction:
For data analysts and researchers, creating professional-quality visualizations is crucial for effectively conveying insights to stakeholders. In the world of programming, R has emerged as a popular language due to its powerful data manipulation and visualization capabilities. One such visualization-saving option in R is the ability to save plots as Scalable Vector Graphics (SVG) files. In this article, we will explore the benefits of saving plots as SVG in R and provide a step-by-step guide on how to accomplish this, along with some frequently asked questions (FAQs) to address common concerns.
Benefits of Saving Plots as SVG in R:
SVG is an XML-based vector image format that allows for high-quality, scalable graphics. Unlike raster image formats such as PNG or JPG that store images as a collection of pixels, SVG files define images using geometric shapes, curves, and text, which ensures that the plot maintains its clarity and sharpness regardless of its size. The resolution-independent nature of SVG makes it ideal for various use cases, including presentation materials, reports, and publications.
Additionally, compared to other vector image formats, SVG is platform-independent and can be easily accessed and modified using any text editor. This versatility allows for effortless customization and adaptation of graphics, enabling users to tweak various plot elements such as colors, fonts, and annotations.
Step-by-Step Guide for Saving Plots as SVG in R:
To save a plot as an SVG file in R, follow these simple steps:
1. Create your desired plot using any of R’s plotting packages, such as base R, ggplot2, or lattice.
2. After ensuring the plot appears correctly in your R console or RStudio, add the following line of code to save it as an SVG file:
“`R
svg(“path/to/save/file.svg”)
“`
3. Once the `svg()` function is called, any subsequent plots or graphical operations will be recorded in the specified SVG file.
4. After you have created all the desired plots, add the following code snippet to close the SVG device and save the output file:
“`R
dev.off()
“`
Now, you have successfully saved your plot as an SVG file. Feel free to modify and adapt the SVG file according to your preferences using various editing tools or directly in R.
FAQs about Saving Plots as SVG in R:
Q1: Can I resize the SVG plot without loss of quality?
A1: Yes, SVG plots can be resized without any loss in quality since they are based on vector graphics. You can scale the plot up or down to suit different requirements without any degradation in sharpness.
Q2: Can SVG plots be embedded in webpages?
A2: Absolutely! SVG files are well-suited for embedding in webpages. Since they are XML-based, they can be easily integrated into HTML code using the `
Q3: Are there any limitations when saving plots as SVG in R?
A3: While SVG offers great flexibility, it is important to note that some complex plot elements, such as transparent gradients or 3D effects, might not be fully supported in SVG. However, for most standard plot types, SVG provides an ideal solution.
Q4: Can I modify the SVG file programmatically in R?
A4: Yes, you can leverage R’s capabilities to programmatically modify SVG files. Various packages, such as ‘xml2’ or ‘svglite’, allow you to extract and manipulate SVG elements directly within your R scripts.
Q5: Are there any performance considerations when using SVG plots?
A5: Compared to raster image formats, SVG files can sometimes be larger in size, which might impact loading times. However, compression techniques like gzip can be applied to reduce file sizes without compromising quality.
Conclusion:
Saving plots as SVG in R offers numerous advantages, such as resizable images, platform independence, and customizable graphics. Whether you want to create presentations, reports, or publications, SVG plots ensure high-quality visuals that remain sharp at any scale. By following the simple steps outlined in this guide, you can easily save your plots as SVG files and unleash your creativity when it comes to visualizing and communicating data in R.
Matplotlib To Svg
SVG is an XML-based vector graphics format that can be rendered by web browsers and other software that supports the SVG specification. SVG files are scalable, meaning they can be zoomed in or out without losing quality, and they are resolution-independent, ensuring that the graphics appear crisp and clear on screens of any size or resolution. This makes SVG an ideal format for creating graphics for web applications, presentations, and other digital media.
To create an SVG plot using Matplotlib, we first need to import the necessary libraries. Matplotlib provides a module called `matplotlib.pyplot` that includes functions for creating plots, and also a module called `matplotlib.figure` that represents the entire figure or canvas on which the plots are drawn. We can import these modules using the following code:
“`python
import matplotlib.pyplot as plt
“`
Next, we need to create the plot using the desired plot type, such as line plots, scatter plots, bar plots, etc. We use various Matplotlib functions to customize the plot, such as setting titles, labels, colors, markers, and axes ranges. Once the plot is ready, we can save it as an SVG file using the `savefig()` function, specifying the file name with the `.svg` extension. Here is a simple example that creates a line plot and saves it as an SVG file:
“`python
import matplotlib.pyplot as plt
plt.plot([1, 2, 3, 4], [1, 4, 9, 16])
plt.title(“Simple Line Plot”)
plt.xlabel(“X-axis”)
plt.ylabel(“Y-axis”)
plt.savefig(“line_plot.svg”)
“`
By default, Matplotlib saves the plot with a size of 6.4 by 4.8 inches and a resolution of 100 dots per inch (DPI). However, we can adjust these settings by specifying the `figsize` and `dpi` parameters in the `savefig()` function. For example, to save a plot with a size of 8 by 6 inches and a resolution of 150 DPI, we can modify the code as follows:
“`python
plt.savefig(“line_plot.svg”, figsize=(8, 6), dpi=150)
“`
SVG files can be easily embedded in HTML documents or used in other software that supports SVG format. They can be opened and edited using various vector graphics editing tools. Furthermore, SVG files can be styled using CSS, allowing for further customization and interactivity.
Now, let’s address some frequently asked questions about Matplotlib to SVG conversion:
**Q1: Can I customize the appearance of the SVG plots generated by Matplotlib?**
A1: Yes, Matplotlib provides a wide range of customization options. You can choose different colors, line styles, marker styles, add legends, annotations, and more. Additionally, you can modify the SVG file using a vector graphics editor or CSS.
**Q2: Can I create interactive plots in SVG format with Matplotlib?**
A2: By default, Matplotlib generates static SVG plots. However, SVG files can be easily modified to include interactivity using JavaScript, HTML, or CSS.
**Q3: Are there any limitations or drawbacks of using the SVG format?**
A3: While SVG is a powerful and versatile format, it may not be suitable for all use cases. SVG files can become large and complex for highly detailed or complex plots, which may impact performance. Additionally, interactive features may require additional development effort.
**Q4: Can I convert existing Matplotlib plots to SVG format?**
A4: Yes, you can convert existing Matplotlib plots to SVG by saving them using the `savefig()` function with the appropriate file extension.
In summary, Matplotlib provides a straightforward and efficient way to generate SVG plots that are scalable, resolution-independent, and customizable. SVG plots are suitable for a variety of applications, including web development, data analysis, scientific research, and more. By leveraging Matplotlib’s extensive functionality, users can create visually appealing and interactive visualizations that can be easily shared and used across platforms and software.
Images related to the topic matplotlib save figure as svg

Found 41 images related to matplotlib save figure as svg theme















Article link: matplotlib save figure as svg.
Learn more about the topic matplotlib save figure as svg.
- How can I get the output of a Matplotlib plot as an SVG
- How can I get the output of a matplotlib plot as an SVG?
- Save Matplotlib Figure as SVG and PDF using Python
- Save Plot as SVG File in Matplotlib – Delft Stack
- Save matplotlib figure as a SVG using Python – CodeSpeedy
- matplotlib.pyplot.savefig — Matplotlib 3.7.2 documentation
- Generating PDF or SVG Documents | Scaler Topics
- Convert Image To SVG Python – Aspose
- PNG vs. SVG: What are the differences? – Adobe
- SVG files: How to create, edit and open them – Adobe
- Save figure SVG from Matlab or Matplotlib | Scientific Computing
- Save Matplotlib graphs as SVG – CodersLegacy
- How to save Matplotlib plot to string as SVG – TechOverflow
See more: https://nhanvietluanvan.com/luat-hoc